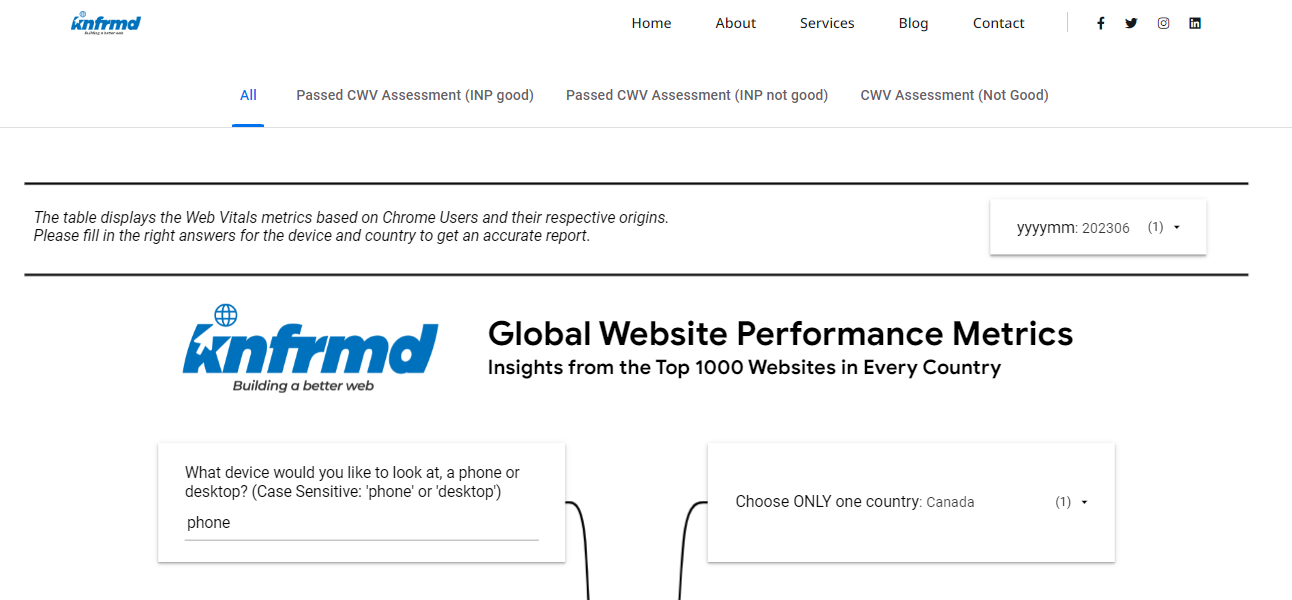
CrUX Report Dashboard
How to Use The Knfrmd CrUX Report Dashboard
Welcome to the Knfrmd CrUX Dashboard. This guide will walk you through the steps to effectively utilize the dashboard and understand its metrics.
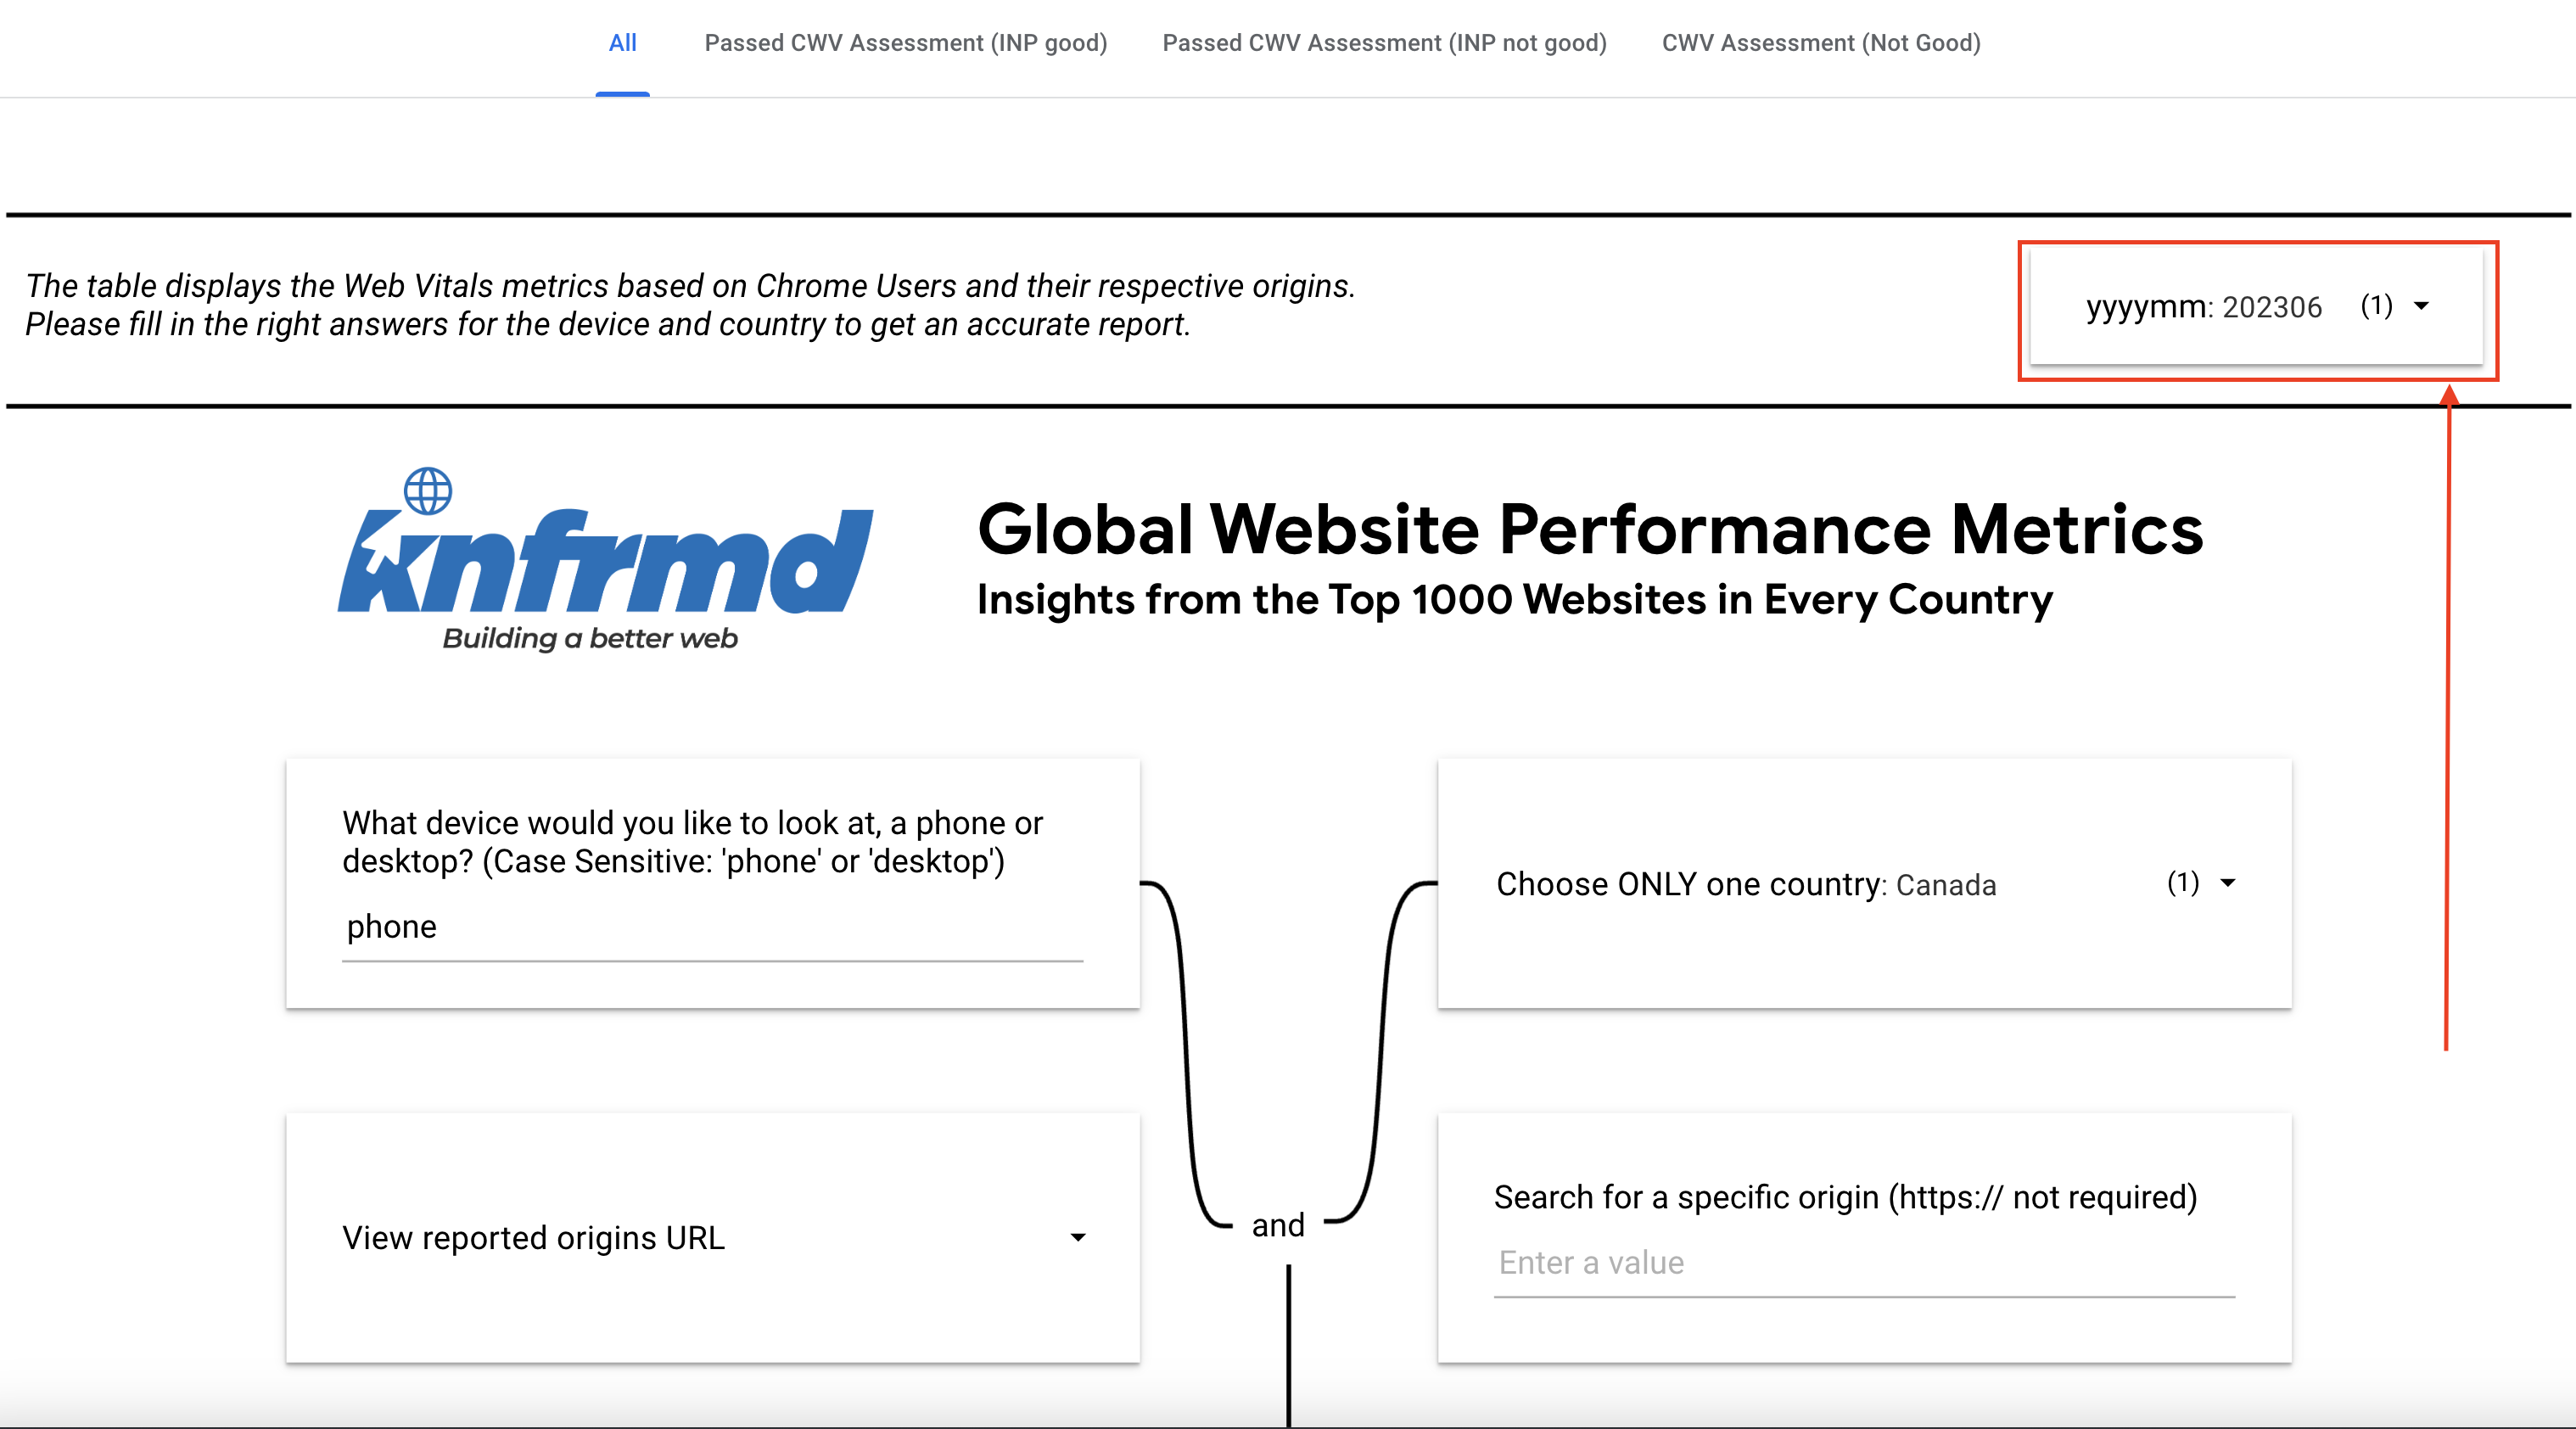
Step 2: Selecting the Date Range
Click the dropdown arrow to choose the date range you want to work with.
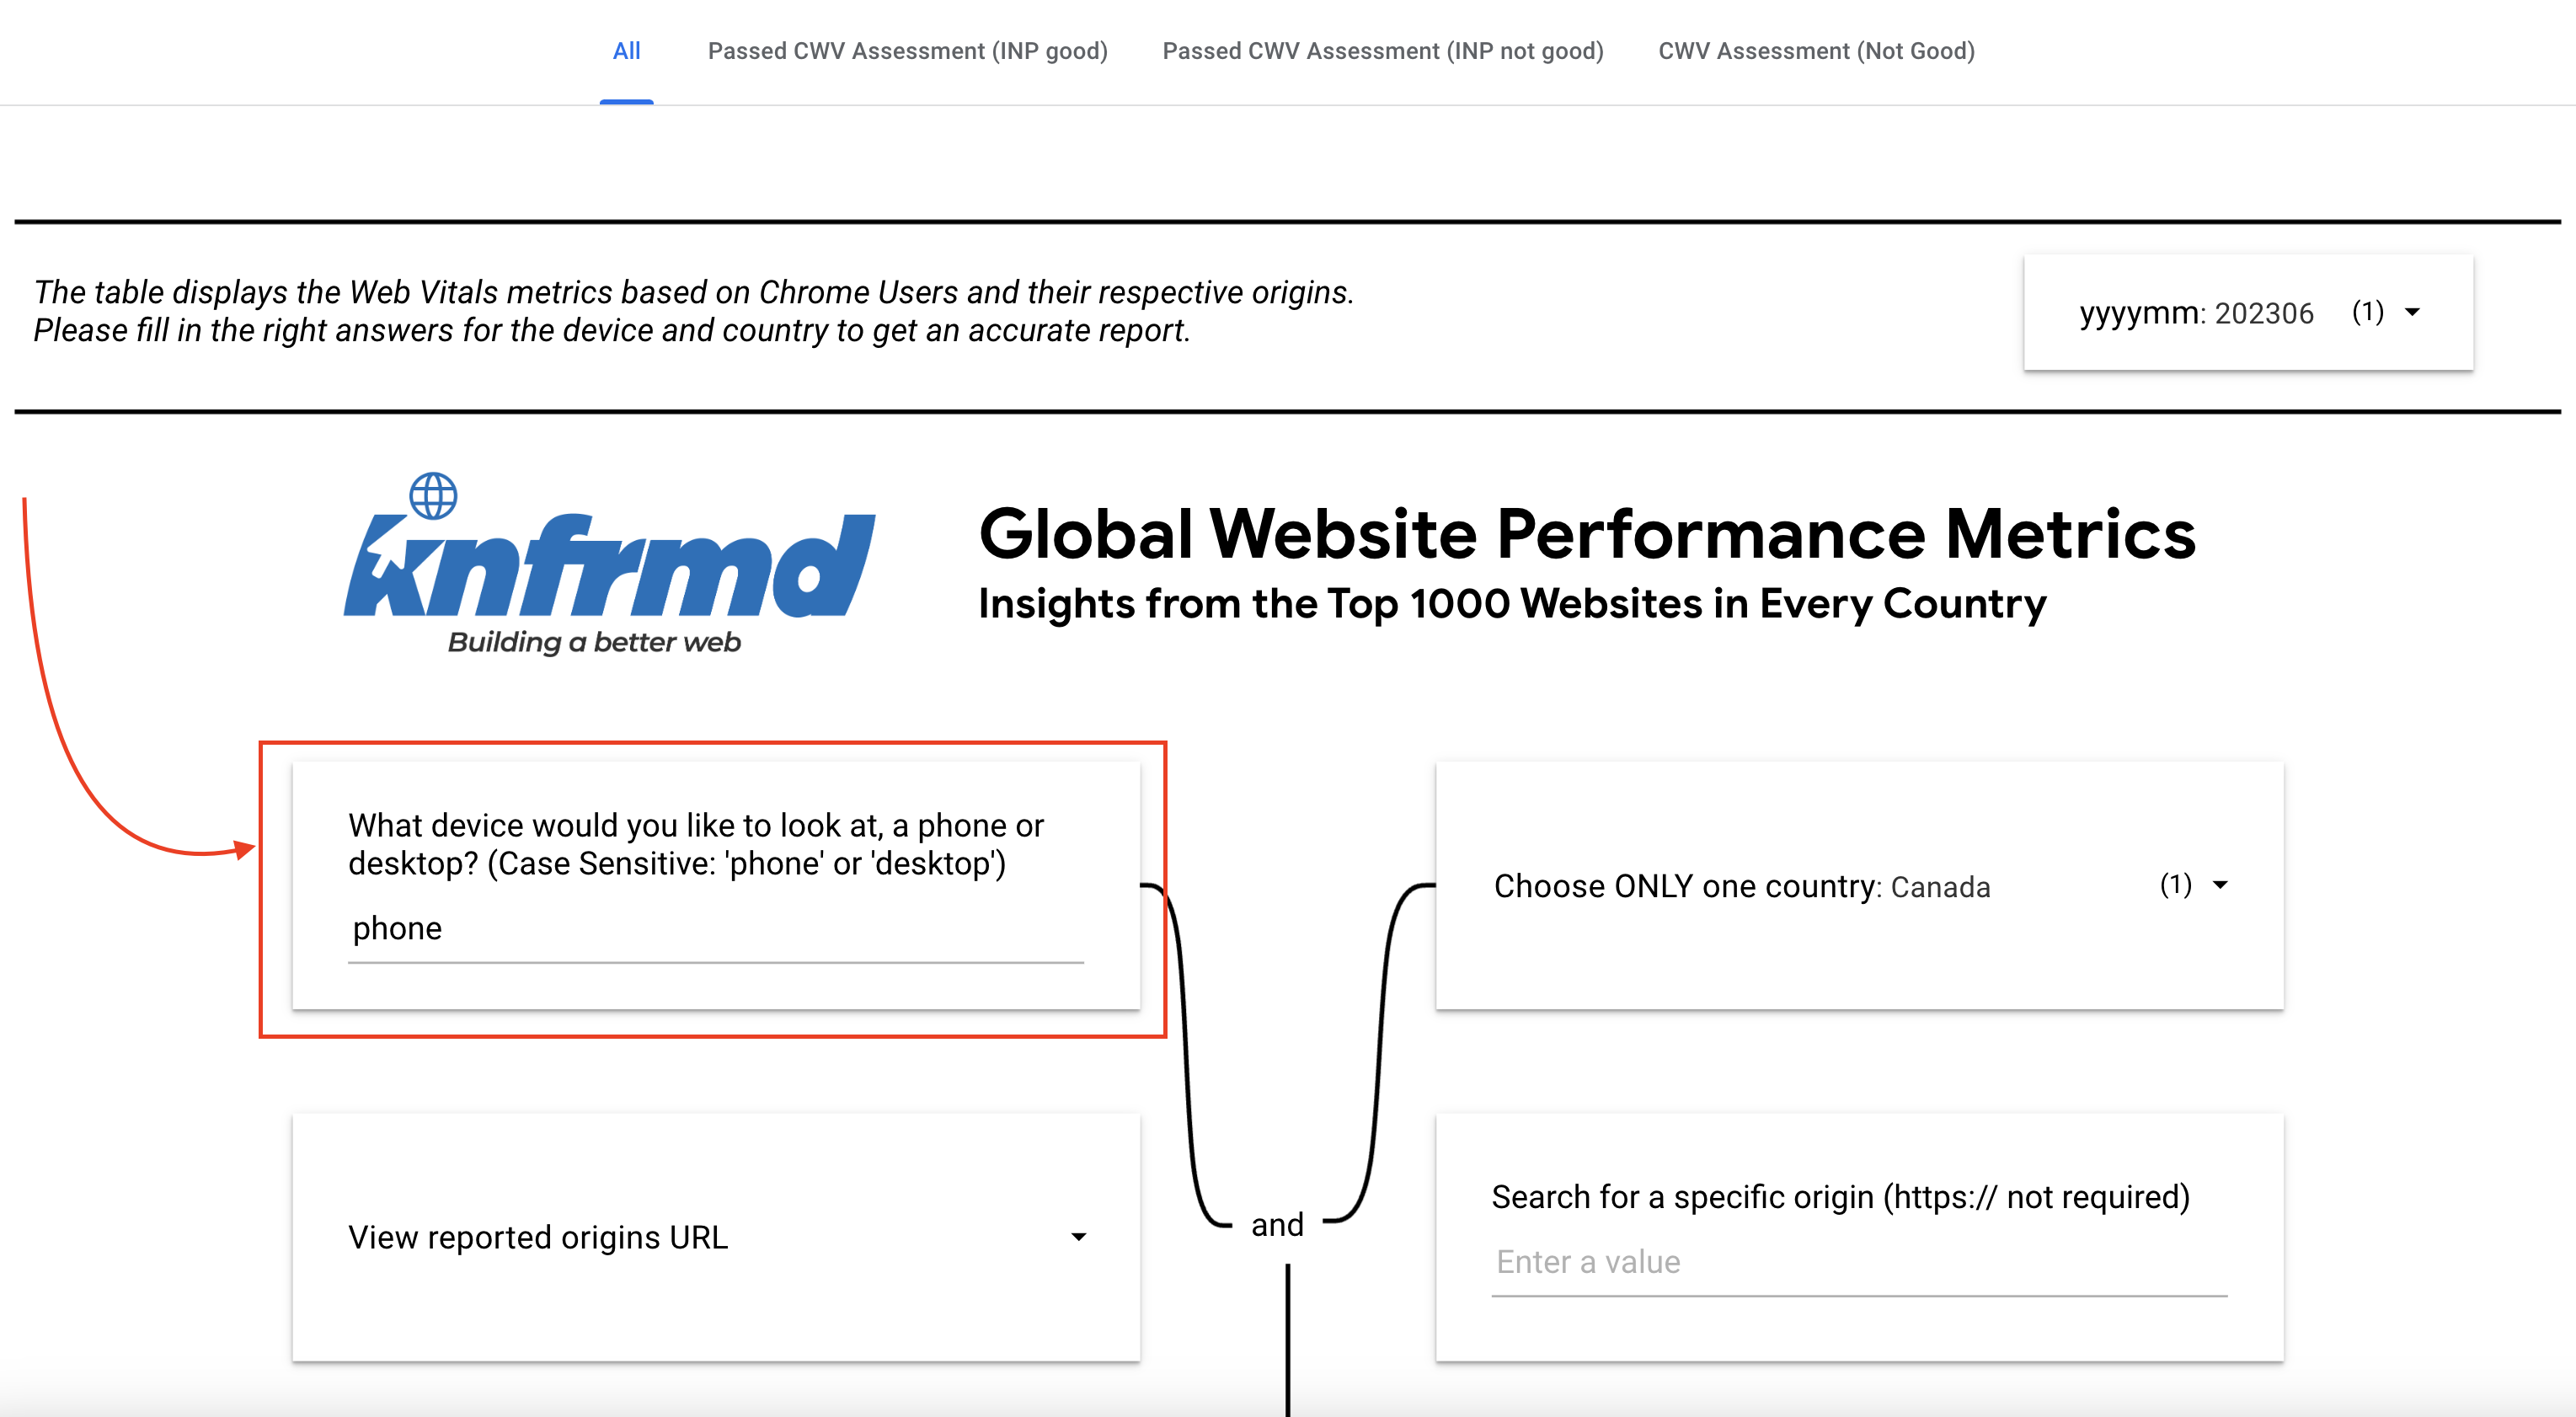
Step 3: Filtering by Device
Type in the device you would like to analyze.
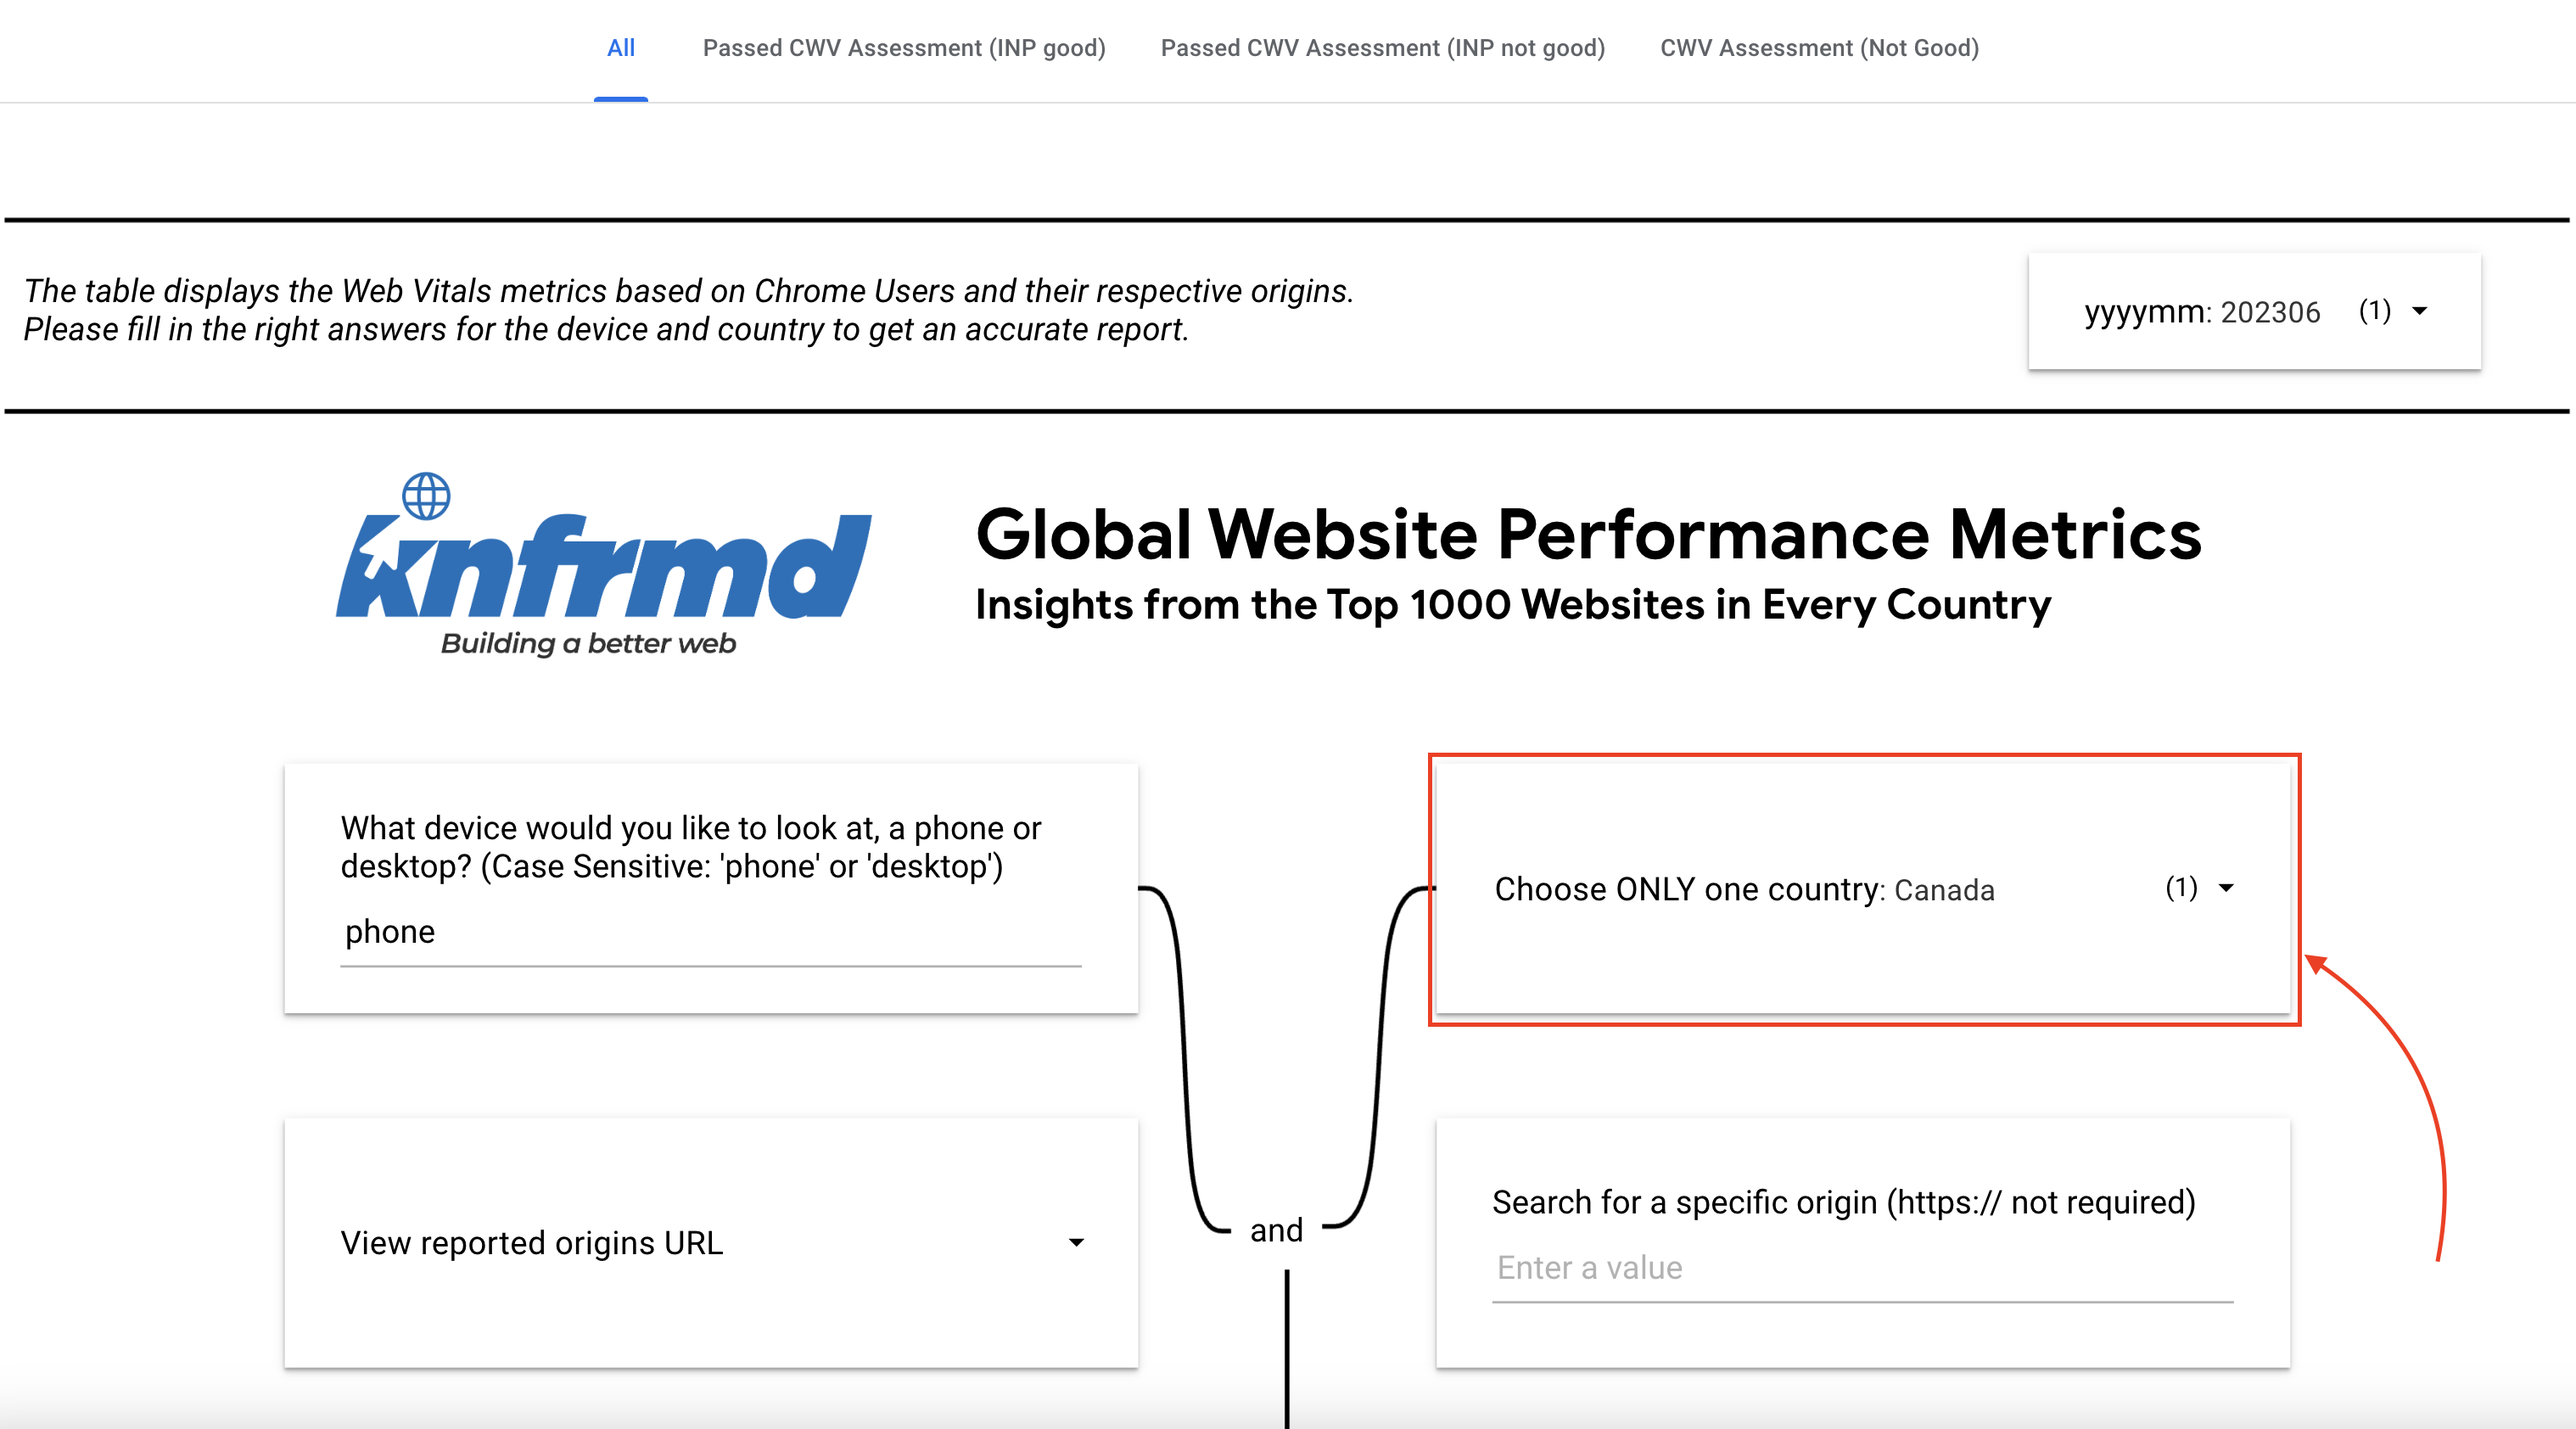
Step 4: Filtering by Country
Click the drop-down arrow and select the country you want to focus on.
Step 5: Filling Out All Fields
Ensure you have filled out all relevant fields to refine your search.
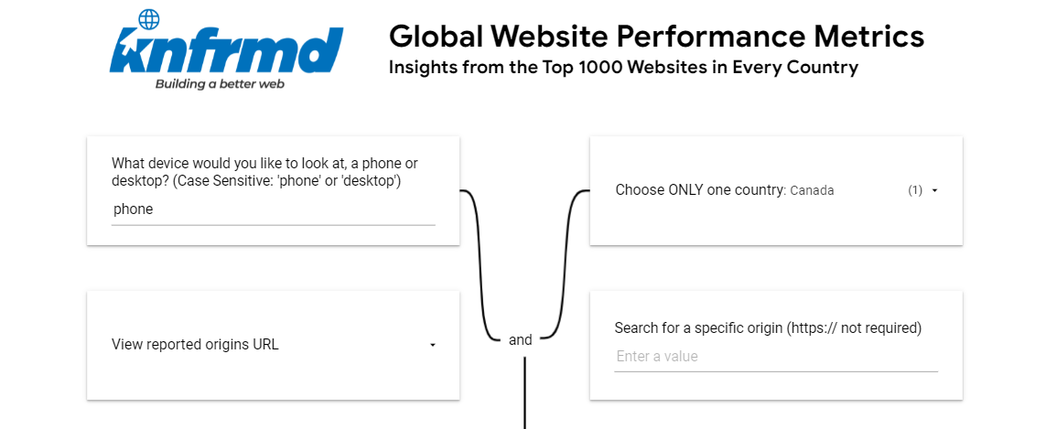
Step 6: Displaying the Results
After completing the steps above, you will have a display of the results of your search.
Now, let's explore the different metrics and tabs available on the dashboard:
Metrics and Tabs:
- TTFB - Time to First Byte (TTFB) measures the duration from the user or client making an HTTP request to the first byte of the page being received by the client's browser. It indicates the responsiveness of a web server or network resource.
- FCP - First Contentful Paint (FCP) measures the time from when the page starts loading to when any part of the page's content is rendered on the screen.
- INP - Interaction to Next Paint (INP) is an experimental metric that measures the responsiveness of a webpage throughout all interactions on a page. A low INP ensures that the page will be reliably responsive at all times.
- LCP - Largest Contentful Paint (LCP) is an important, stable Core Web Vital metric for measuring perceived load speed. It marks the point in the page load timeline when the page's main content has likely loaded—a fast LCP helps reassure the user that the page is useful.
- Onload - is a script execution event that occurs after a web page has completely loaded all content, including pictures, script files, CSS files, and so on1. The onload event can be used to determine the visitor's browser type and version and then load the appropriate version of the web page based on that information.
- CLS - Cumulative Layout Shift is a stable Core Web Vital metric. It quantifies how often users experience unexpected layout shifts. A low CLS helps ensure that the page is delightful.
Color Indicators:
- Green: Good
- Orange: Can be improved
- Red: Bad and should be improved
Please note that all the results displayed in the 'ALL' tab show general results for the selected criteria.
For more tailored results, consider using the following options:
- Passed CWV Assessment (INP Good): For sites that passed the Core Web Vitals assessment and have a good INP,
- Passed CWV Assessment (INP Not Good): For sites that passed the Core Web Vitals assessment but have bad INP.
- CWV Assessment (Not Good): For sites that didn't pass the Core Web Vitals assessment.
By following these steps and understanding the metrics and color indicators, you can effectively use the CRuX Report Dashboard to analyze web performance and make necessary improvements.

